

Heart Block
Definition: It is disturbance in the normal transmission of impulses generated in “SAN”.
Cause: Coronary artery disease (ie. decreased blood supply to the myocardium).
Types:
(A) Sino-atrial’ nodal block:
Level of block: at SAN ie block within the substance of SAN
(B) ‘Atrio-ventricular’ nodal block:
Level of block: at AVN ie block within the substance of AVN
(C) Bundle branch block (BBB):
Level of block: at bundle of His i.e. block of one of the branches of bundle of His
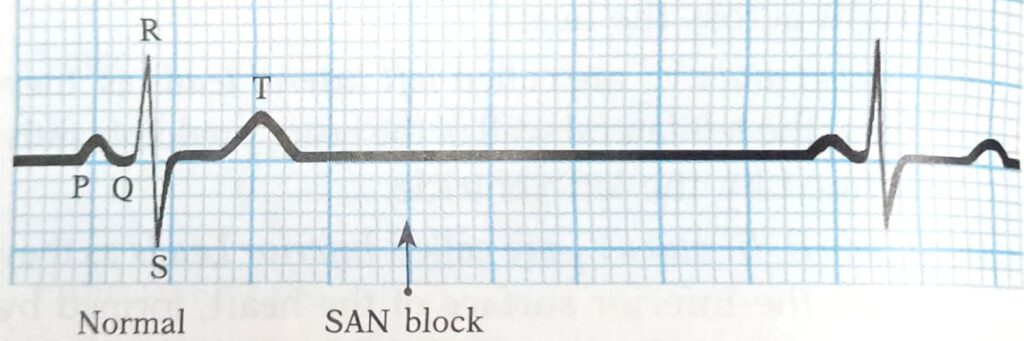
A. Sino-Atrial Nodal Block
Initially whole heart beat is lost i.e. neither atrial nor ventricular contractions occur. After an interval of approx. two cardiac cycle, the heart resumes its normal action of the as some new pacemaker other than SAN takes over.
B. Atrio-Ventricular Nodal Block
This produces disturbance of conduction between atria and ventricles. It is of two types:
1. Incomplete (partial) heart block; and
2 Complete heart block
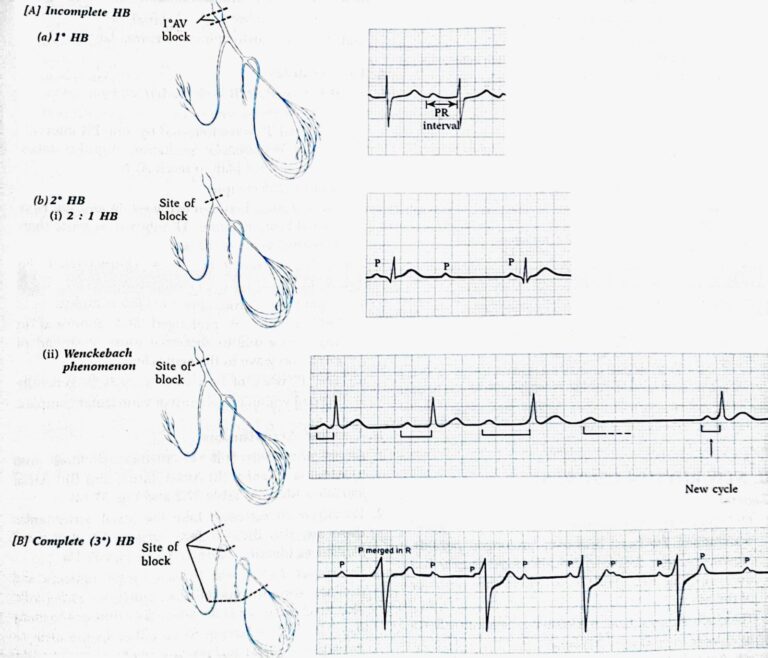
1. Incomplete’ heart block-It is due to partial break of conduction between atria and ventricles. It is of two types: First and second degree incomplete heart block.
First degree’ incomplete heart block
When all atrial impulses reach the ventricles but PR interval is abnormally long (> 0.2 sec); however, atrial rate: ventricular rate: : 1 : 1.
Second degree‘ incomplete heart block
When all atrial impulses are not conducted to the ventricles producing:
(i) 2:1 or 3:1 heart block (atrial: ventricular rate :: 2 : 1 and 3: 1 respectively) or
(ii) ‘Wenckebach’ phenomenon i.e. gradual lengthening of ‘PR interval’ until one ventricular beat is dropped and the cycle being repeated indefinitely.
2 Complete (or III degree) heart block – It is due to complete interruption (break) of conduction between atria and ventricles. Therefore, ventricles beat with a slower rate (45 bpm) and independent of rhythm of SAN’, called as idio-ventricular rhythm
If complete heart block develops suddenly, there occurs a delay before ventricles start beating at their own rate. During this period the systemic blood pressure falls to a very low level and blood supply to brain becomes inadequate. If ventricular standstill (stoppage) lasts for few seconds, it causes dizziness and faintness, called Stokes Adams syndrome; or if it is more prolonged (exceeds 1 or 2 minutes) it leads to loss of consciousness, convulsions and death. (Because almost no glucose is stored in the brain, the supply of glucose also must be continuous).
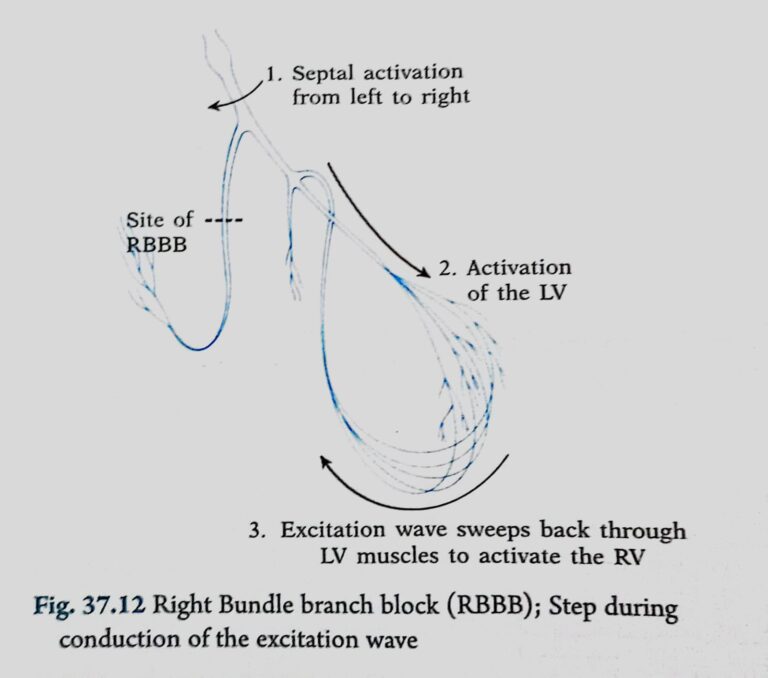
C. Bundle Branch Block (BBB)
That is, block of one of the branches of bundle of His (right or left), therefore, excitation process passes normally down to bundle on the intact side and then sweeps back through the muscles to activate the ventricle on the blocked side (Fig. 37.12). It is characterised by:
1. normal heart rate
2. prolongation of QRS complex (>0.12 sec) with abnormal appearance
3. abnormal ST segment and T-wave (because repolarization is also affected)
4. Split 2nd heart sound (HS,). How?
Normally, right ventricle (RV) contracts after left ventricle (LV), therefore,
(i) in Right BBB (RBBB): ‘RV’ contracts after ‘LV’, producing prolongation of HS, as A2P2
(ii) in Left BBB (LBBB): ‘RV’ contracts much before ‘LV’, producing prolongation of HS, as P2A2
Draw a normal ECG and label their components
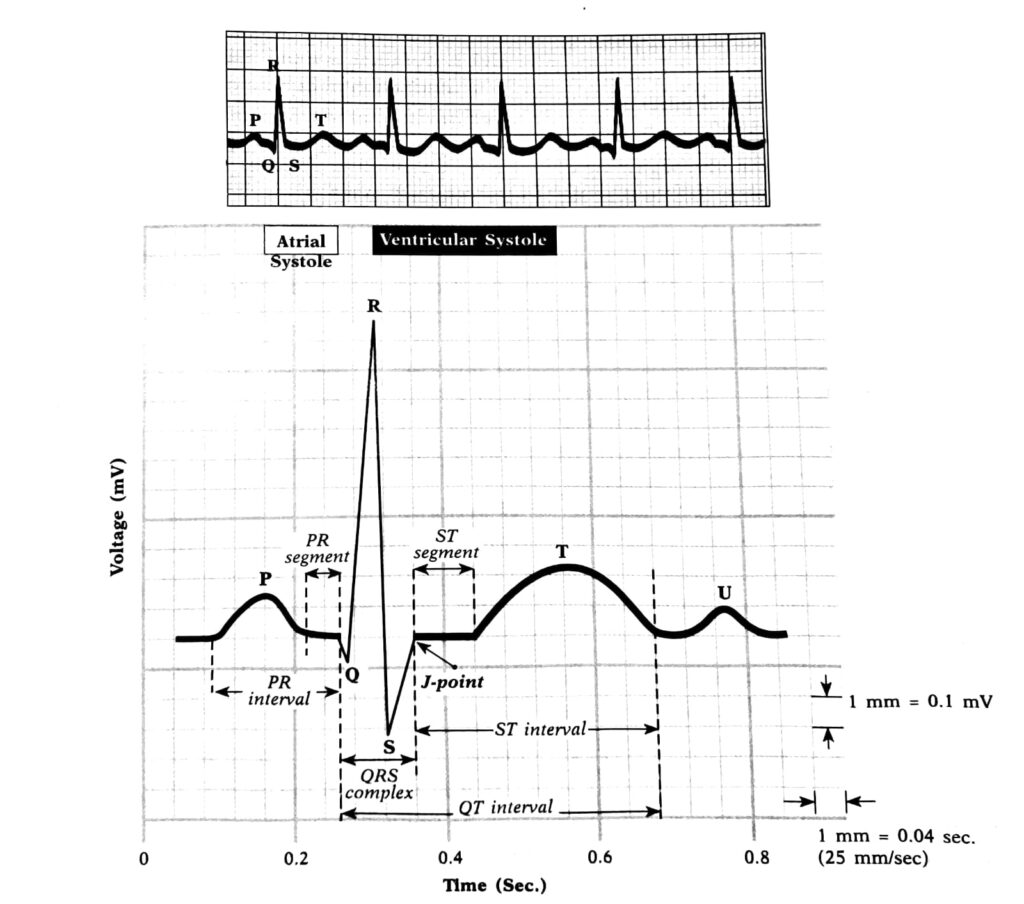
P wave:
- Represents: Atrial depolarization.
- Description: It indicates the spread of an electrical impulse through the atria, leading to their contraction (systole). It’s the first small upward wave seen on the ECG.
QRS complex:
- Represents: Ventricular depolarization.
- Description: This complex denotes the spread of an electrical impulse through the ventricles, leading to their contraction. Atrial repolarization also occurs during this time but is obscured by the larger QRS complex.
- Q wave: The first negative deflection after the P wave.
- R wave: The first positive deflection after the P wave. It’s the tallest wave in most cases.
- S wave: The negative deflection following the R wave.
T wave:
- Represents: Ventricular repolarization.
- Description: After the ventricles contract, they need to reset electrically. This resetting or “repolarization” is shown by the T wave. It’s generally an upward curve, though its exact shape can vary.
- Segments and Intervals:
- PR interval:
- Represents: The time taken for an electrical impulse to travel from the sinus node through the atrioventricular node and then to the ventricles.
- Description: Measured from the beginning of the P wave to the start of the QRS complex. A normal PR interval is between 120 to 200 milliseconds.
- ST segment:
- Represents: The period when the ventricles remain depolarized.
- Description: It starts at the end of the QRS and ends at the beginning of the T wave. Changes in the ST segment can indicate heart damage or other conditions like myocardial infarction or ischemia.
- QT interval:
- Represents: The total time taken for the ventricles to depolarize and repolarize.
- Description: Measured from the beginning of the QRS complex to the end of the T wave. The length of the QT interval can vary based on heart rate and can be a marker for certain heart conditions when prolonged or shortened.
Conducting system of the heart
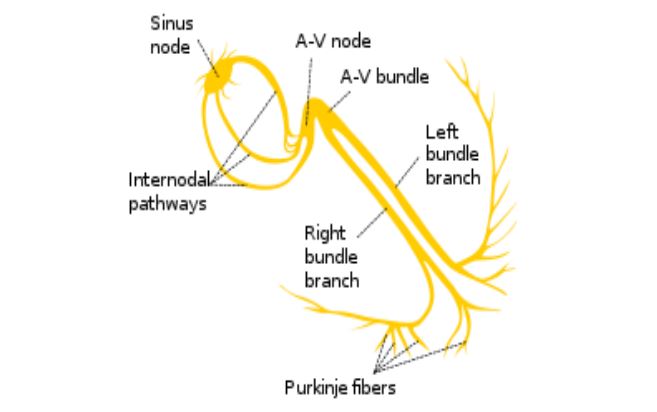
Origin & Conduction of cardiac impulse
SA node
↓
Intermodal pathway
↓
AV node
↓
AV bundle
↓
Bundle branches
↓
Purkinje fibers
- Internodal pathways
• Connects S-A node to A-V node
• Comprise of three bundles
• Anterior – Bachman
• Middle – Wenkebach
• Posterior – Thorel - Conduction Rate (meter/second)
• SA Node —- — 0.05 m/s
• AV Node —– — 0.05 m/s
• Atrial Pathway —– 1 m/s
• Ventricular Muscle— 1 m/s
• Bundle of his ———- 1 m/s
• Purkinje Fibres ——– 4 m/s - AV Nodal Delay
• AV Nodal Delay- O.1sec
• Allows Atria to complete its contraction
• Helps in proper filling of ventricles
• Decreases in stimulation of sympathetic nerves
• Increases in stimulation of vagus - Septal activation
• Depolarization of the ventricular muscle starts on the left side of the interventricular septum and moves to the right across the mid portion of the septum
• Wave of depolarization spreads down the septum to the apex of the heart & activates the apex on either side
• From the apex the impulse passes along the ventricular walls towards the base of the heart at the AV groove
• Endocardial surface of the ventricle is activated by the Purkinje fibres
• Impulse passes from the endocardial to epicardial surface of the ventricle
• The last part of the heart to be depolarized posteriobasal portion of the left ventricle (Pulmonary conus & uppermost portion of the septum)
Give Reasons of AV nodal delay
• The delay in the conduction of cardiac impulse through AV node is called
AV nodal delay
• It is for about 0.1 second
Causes:
– Small & primitive fibers
– Presence of few gap junctions
– RMP is more negative
Significance:
– Gives sufficient time for completion of atrial contraction
– Prevents overlapping of atrial and ventricular systole
– Allows sufficient time for ventricular filling